Intro to Computational Media - TwiTerra Conclusion
Baby’s first ITP Show!
project page here with previous posts and a new video
(I apologize for not posting again sooner on this project – things got pretty hectic as the show neared, and I kept the project page (linked above) up to date instead.)
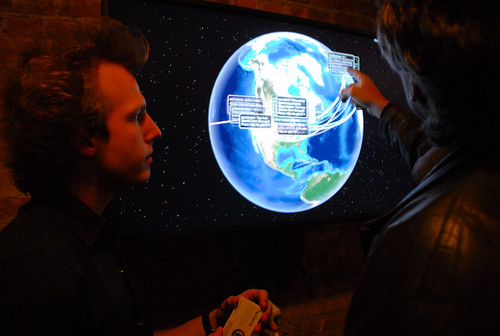
On December 17th and 18th I presented TwiTerra at ITP’s Winter Show – an estimated 2400 people attended to see the 100+ student projects on display. People seemed to enjoy my visualization, and it was a lot of fun (and exhausting) to explain it so many times to so many different people. My standard line was, “Hi, are you familiar with Twitter?”
I’d like to thank everyone who took pictures at the show, especially second-year ITP student David Steele Overholt, whose photos are below:

TwiTerra got mentioned in several write-ups of the show (let me know if you know of more!
- Nerdabout New York: ITP Winter Show 2008
- Wiredset / Blogs / Mark Ghuneim: ITP Winter Show 2008 – Highlights
- Infringing Actions: Report from NYU’s ITP Winter Show
A list of general online press from the show can be found here.
Notably, several people at the show mentioned Facebook’s Project Palantir, a “project that visualizes all the data Facebook receives.” I hadn’t known of it until after the show (perhaps I was too busy with TwiTerra and missed when the link was spreading), but is another globe-based visualization of online communication. It doesn’t show the actual content of the messages, though (and can’t, since Facebook users expect privacy), and it’s something only Facebook employees/engineers could build (since the rest of us don’t have access to that data). Twitter, in contrast, makes its data publicly available and easily accessible via a powerful API.
Finally, I want to thank everyone who helped at various stages of this project, especially my friend Jorge Ortiz (who finally has a blog!), my instructor Dan Shiffman (who can look at a function in a programming language he doesn’t know and instantly find a way to make it two thirds shorter and much simpler), and Patrick Murris of the World Wind Development Team for his prompt responses to a few technical issues I had.